Code along 06
2026-10-12
By the end of today, you’ll be able to:
tidy() and cast_dtm()Today the algorithm proposes the groups of words.
Think of it as a machine’s first pass at open coding: a starting point to check and rename, not a finished codebook.
The Ultimate Goal
This is what we’ve been working towards being able to do all semester. All prior work leads us to the point of being able to use LDA to learn about our text documents in a shorter time frame compared to open coding.
LDA (latent Dirichlet allocation) lets an algorithm discover topics in a pile of documents. No labels, no codebook.

First we look at how to get the text into the necessary shape. Then we fit the model and read what comes out.

We met the name back in lesson 03: “Four ways to store text.”
AssociatedPress<<DocumentTermMatrix (documents: 2246, terms: 10473)>>
Non-/sparse entries: 302031/23220327
Sparsity : 99%
Maximal term length: 18
Weighting : term frequency (tf)
News articles from the Associated Press: each row is an article, each column a word. The header already says Sparsity: 99%. What does that mean?

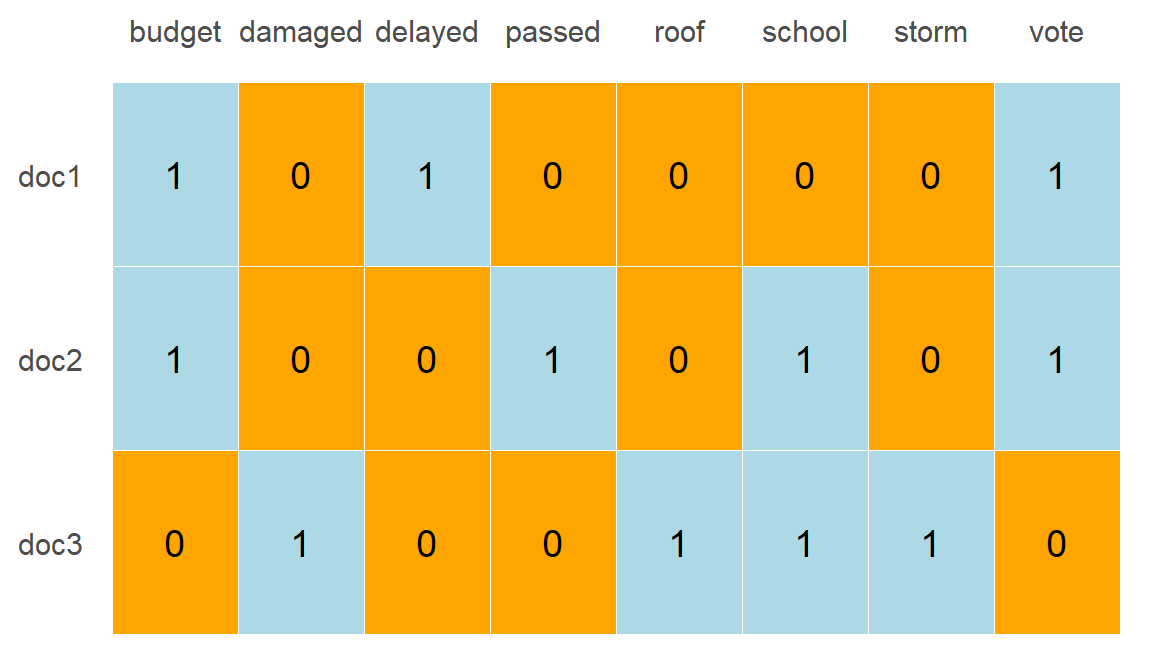
Sparsity = the percent of cells in a matrix that are 0.
A document uses only a few of the words in the whole collection, so every row is mostly zeros.
AssociatedPressFull data is 2,246 rows (articles) by 10,473 columns (terms).
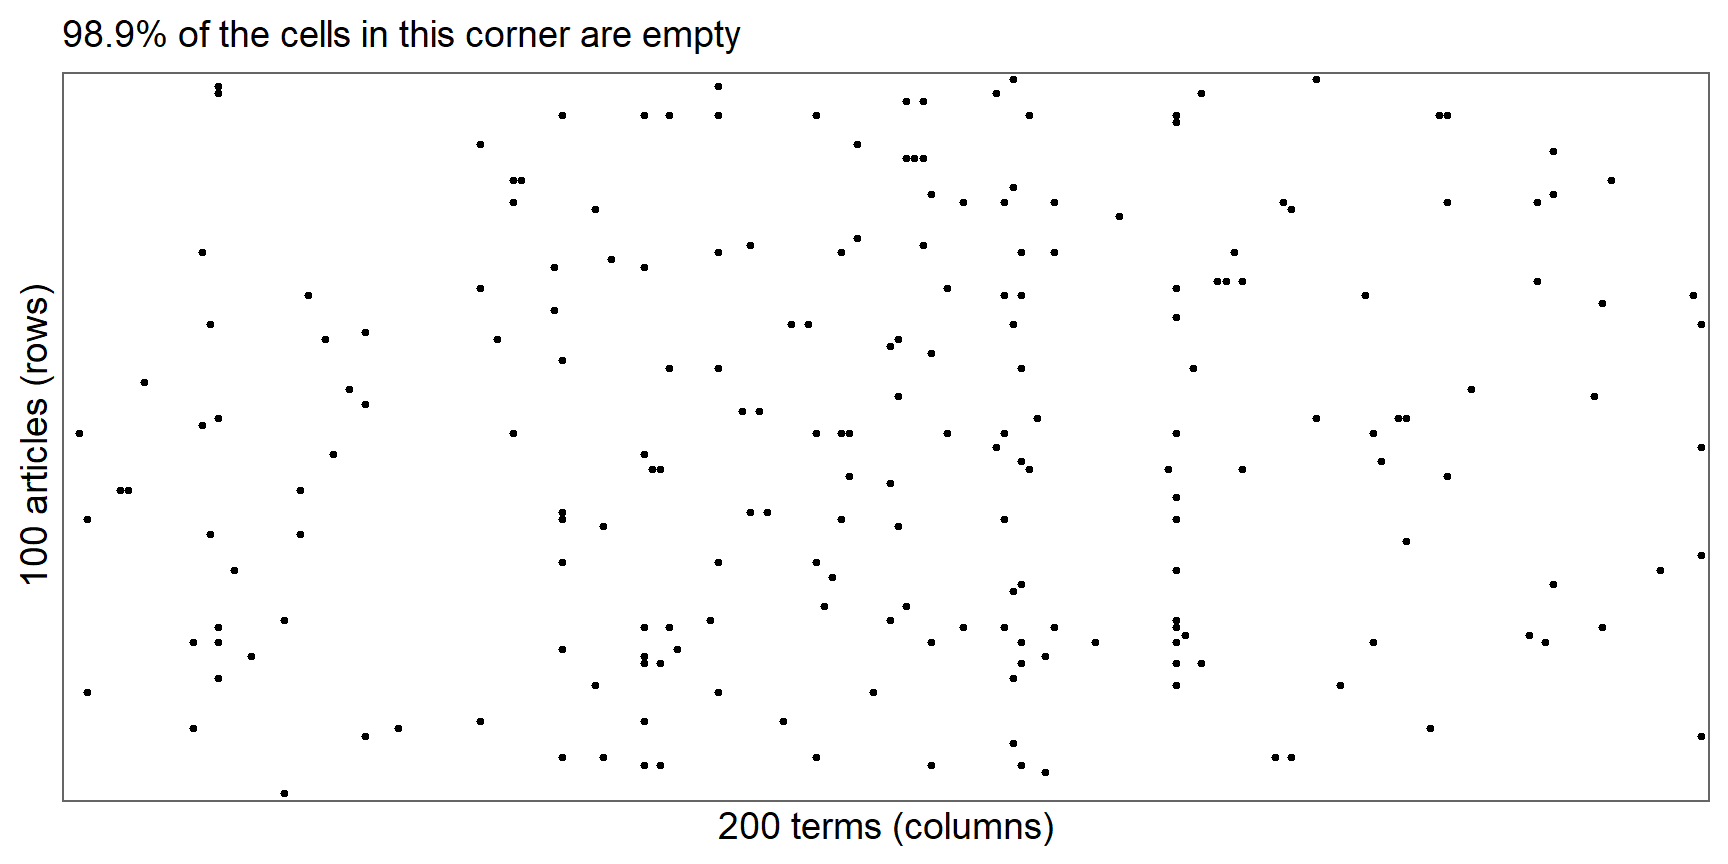
Using the AP data as an example,
# A tibble: 1 × 4
total_cells filled empty pct_empty
<int> <int> <int> <dbl>
1 23522358 302031 23220327 98.7
tidy()Before: the DTM
Only the filled cells become rows. The zeros are gone.
AssociatedPress# A tibble: 302,031 × 3
document term count
<int> <chr> <dbl>
1 1 adding 1
2 1 adult 2
3 1 ago 1
4 1 alcohol 1
5 1 allegedly 1
6 1 allen 1
7 1 apparently 2
8 1 appeared 1
9 1 arrested 1
10 1 assault 1
# ℹ 302,021 more rows
term here, where our tidy text used word.# A tibble: 3 × 2
document text
<chr> <chr>
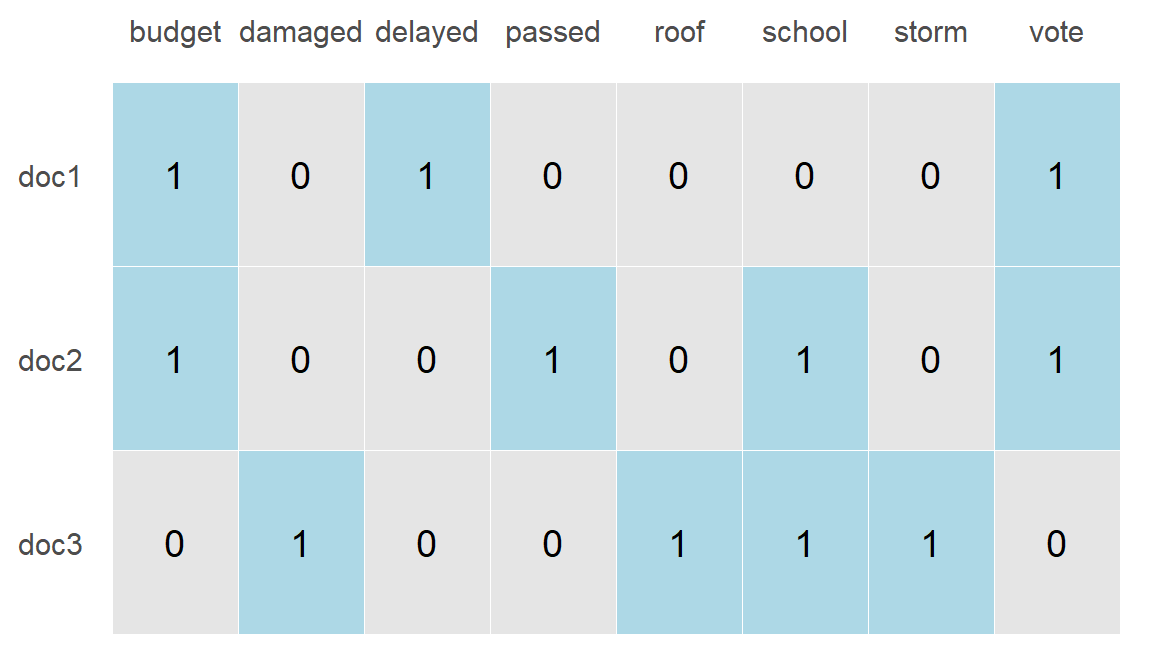
1 doc1 The budget vote was delayed again
2 doc2 The vote on the school budget passed
3 doc3 The storm damaged the school roof
# A tibble: 11 × 3
document word n
<chr> <chr> <int>
1 doc1 budget 1
2 doc1 delayed 1
3 doc1 vote 1
4 doc2 budget 1
5 doc2 passed 1
6 doc2 school 1
7 doc2 vote 1
8 doc3 damaged 1
9 doc3 roof 1
10 doc3 school 1
11 doc3 storm 1
This is the shape we know from lessons 03 to 05: one row per document-word pair.
cast_dtm()<<DocumentTermMatrix (documents: 3, terms: 8)>>
Non-/sparse entries: 11/13
Sparsity : 54%
Maximal term length: 7
Weighting : term frequency (tf)
document → the rowsword → the columnsn → the number in each cell
Same counts as the tidy table, now in a grid with the zeros filled back in. This is the shape LDA needs.
Try it yourself
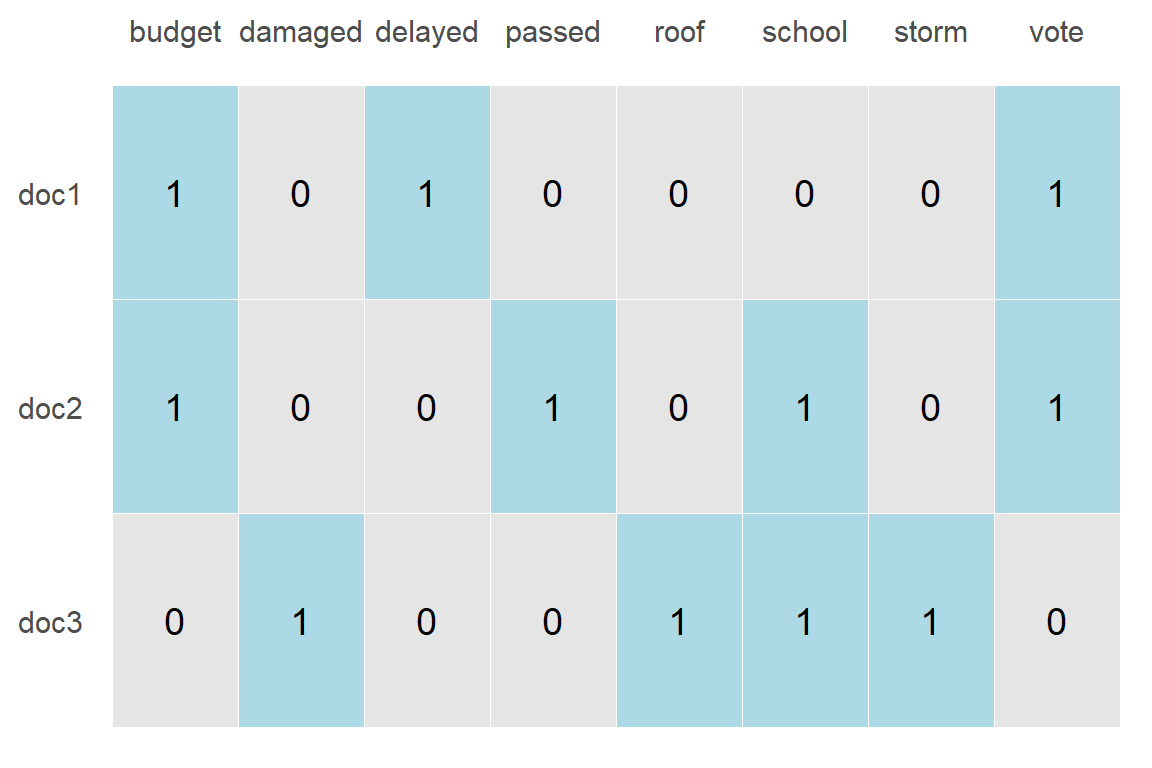
Use the matrix below to answer these questions. Do not use code here. 👀 + 🧠 only
Terms
Docs budget delayed vote passed school damaged roof storm
doc1 1 1 1 0 0 0 0 0
doc2 1 0 1 1 1 0 0 0
doc3 0 0 0 0 1 1 1 1
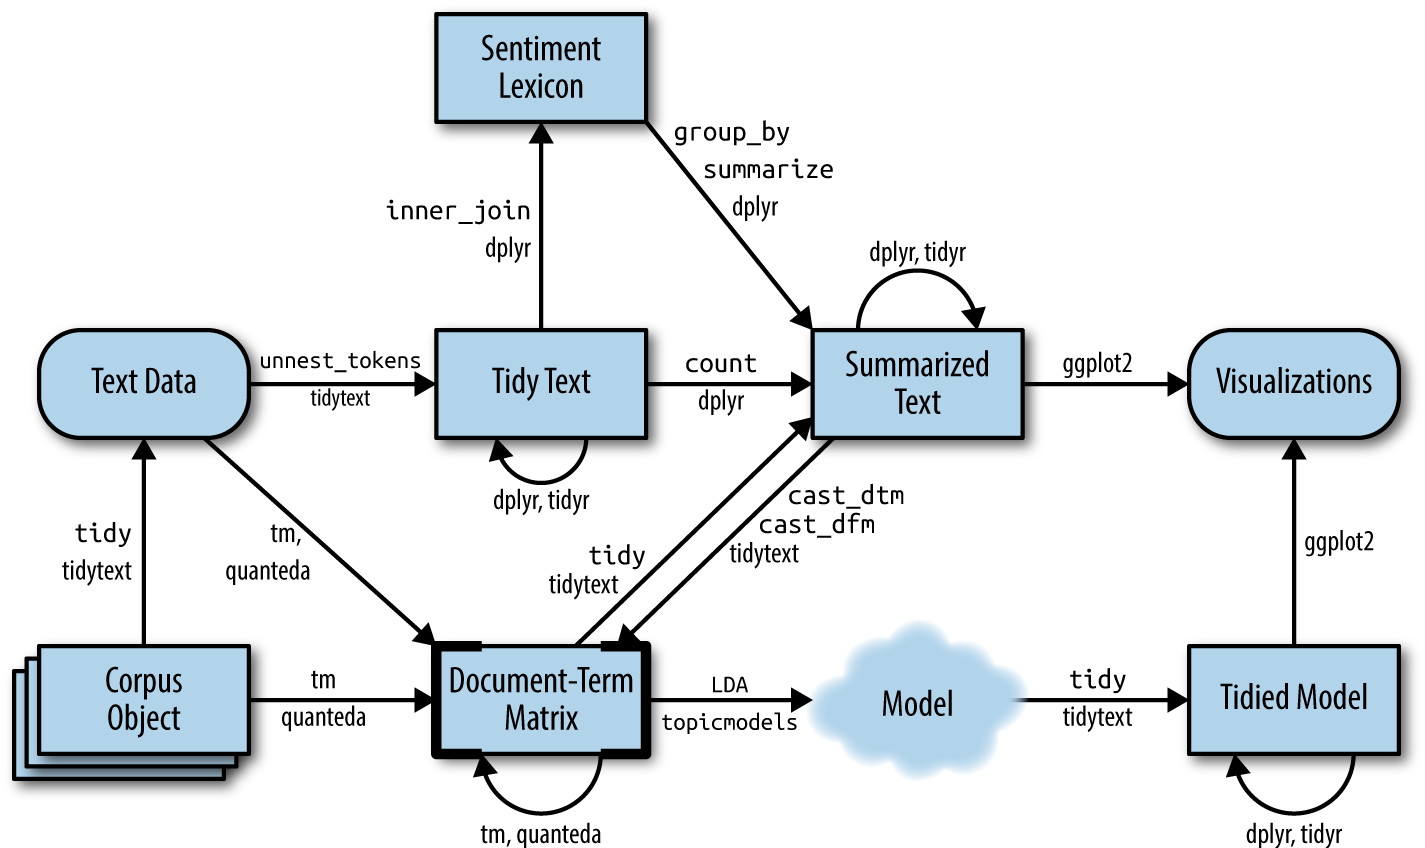
A flowchart of a text analysis that uses topic modeling: the topicmodels package takes a document-term matrix as input and produces a model that tidytext can tidy, so it can be manipulated and visualized with dplyr and ggplot2.
Figure 6.1 from Silge & Robinson, Text Mining with R, used under CC BY-NC-SA 3.0 US.
LDA looks for hidden (“latent”) groups of words. We never observe topics, only the words in the DTM.
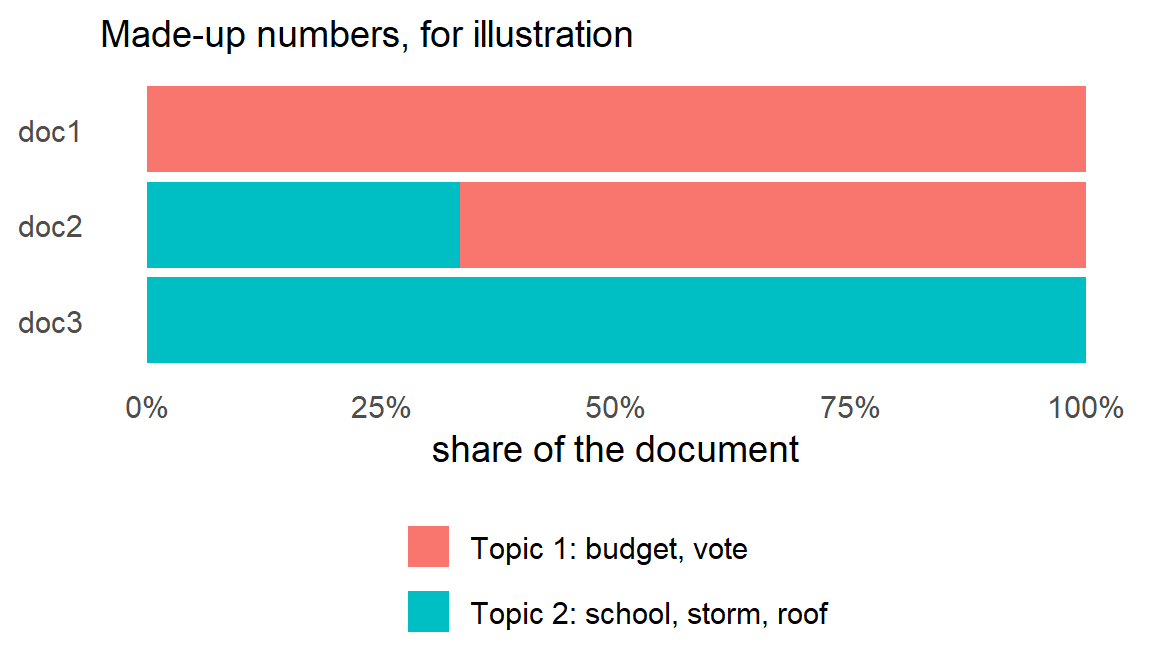
1. Every document is a mixture of topics. One article might be mostly about the budget and a little about schools.
2. Every topic is a mixture of words. And words can be shared: “budget” can matter in both a politics topic and an education topic.
LDA only sees counts, a conceptual bag of words.
| Question it answers | Adds up to 1 across | |
|---|---|---|
| \(\beta\) (beta) | \(P(\text{word} \mid \text{topic})\): how likely is this word within this topic? | all words, within one topic |
| \(\gamma\) (gamma) | \(P(\text{topic} \mid \text{document})\): how much of this document comes from this topic? | all topics, within one document |
To estimate these probabilities, we use an algorithm containing a random “walk”. A random walk is a series of guesses (estimates) starting at a random point, and iterating until it gets closer (converges) to a value. The Dirichlet probability distribution is what we use to model mixtures like topics and documents.
Zero inflated models are also mixture models.
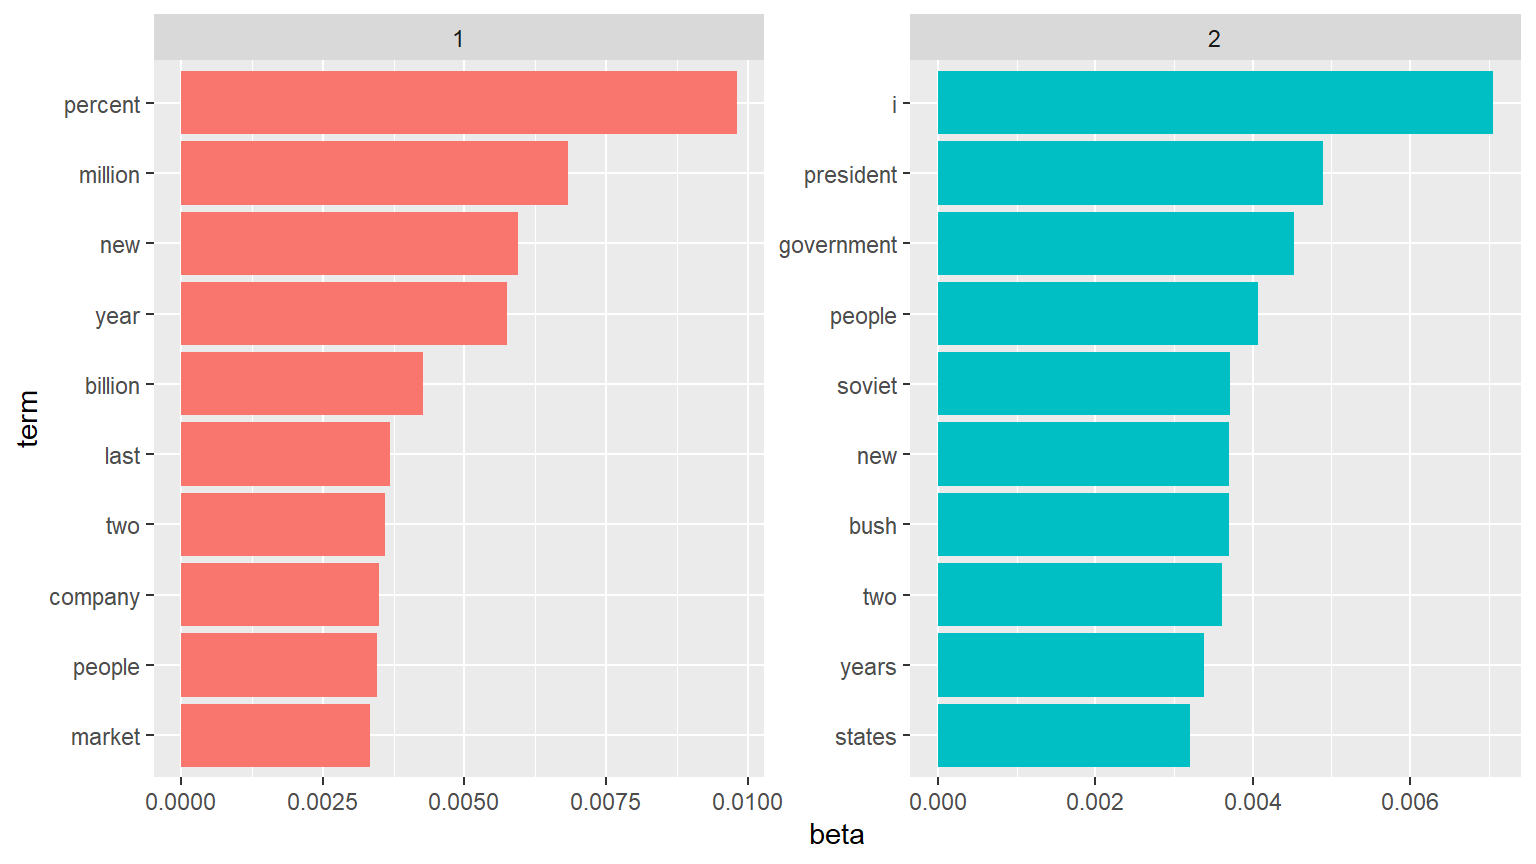
A LDA_VEM topic model with 2 topics.
k = 2: we choose the number of topicsseed: LDA starts from a random starting point.A seed is needed so that everyone’s algorithms start at the same point, resulting in the same answer every time (reproducible).
Different seeds can give different topics. We’ll come back to why, and how to check, at the end.
# A tibble: 6 × 3
topic term beta
<int> <chr> <dbl>
1 1 aaron 1.69e-12
2 2 aaron 3.90e- 5
3 1 abandon 2.65e- 5
4 2 abandon 3.99e- 5
5 1 abandoned 1.39e- 4
6 2 abandoned 5.88e- 5
Watch the notation
1.69e-12 is scientific notation for 0.00000000000169
What would you “name” each topic? Remember this data set contains news articles from the AP.
beta_wide <- ap_topics |>
mutate(topic = paste0("topic", topic)) |>
# pivot wider to get one row per term, one column per topic
pivot_wider(names_from = topic, values_from = beta) |>
# keep terms common enough in at least one topic to matter
filter(topic1 > .001 | topic2 > .001) |>
mutate(log_ratio = log2(topic2 / topic1))
head(beta_wide)# A tibble: 6 × 4
term topic1 topic2 log_ratio
<chr> <dbl> <dbl> <dbl>
1 administration 0.000431 0.00138 1.68
2 ago 0.00107 0.000842 -0.339
3 agreement 0.000671 0.00104 0.630
4 aid 0.0000476 0.00105 4.46
5 air 0.00214 0.000297 -2.85
6 american 0.00203 0.00168 -0.270
log2(topic2 / topic1):
# A tibble: 6 × 4
term topic1 topic2 log_ratio
<chr> <dbl> <dbl> <dbl>
1 administration 0.000431 0.00138 1.68
2 ago 0.00107 0.000842 -0.339
3 agreement 0.000671 0.00104 0.630
4 aid 0.0000476 0.00105 4.46
5 air 0.00214 0.000297 -2.85
6 american 0.00203 0.00168 -0.270
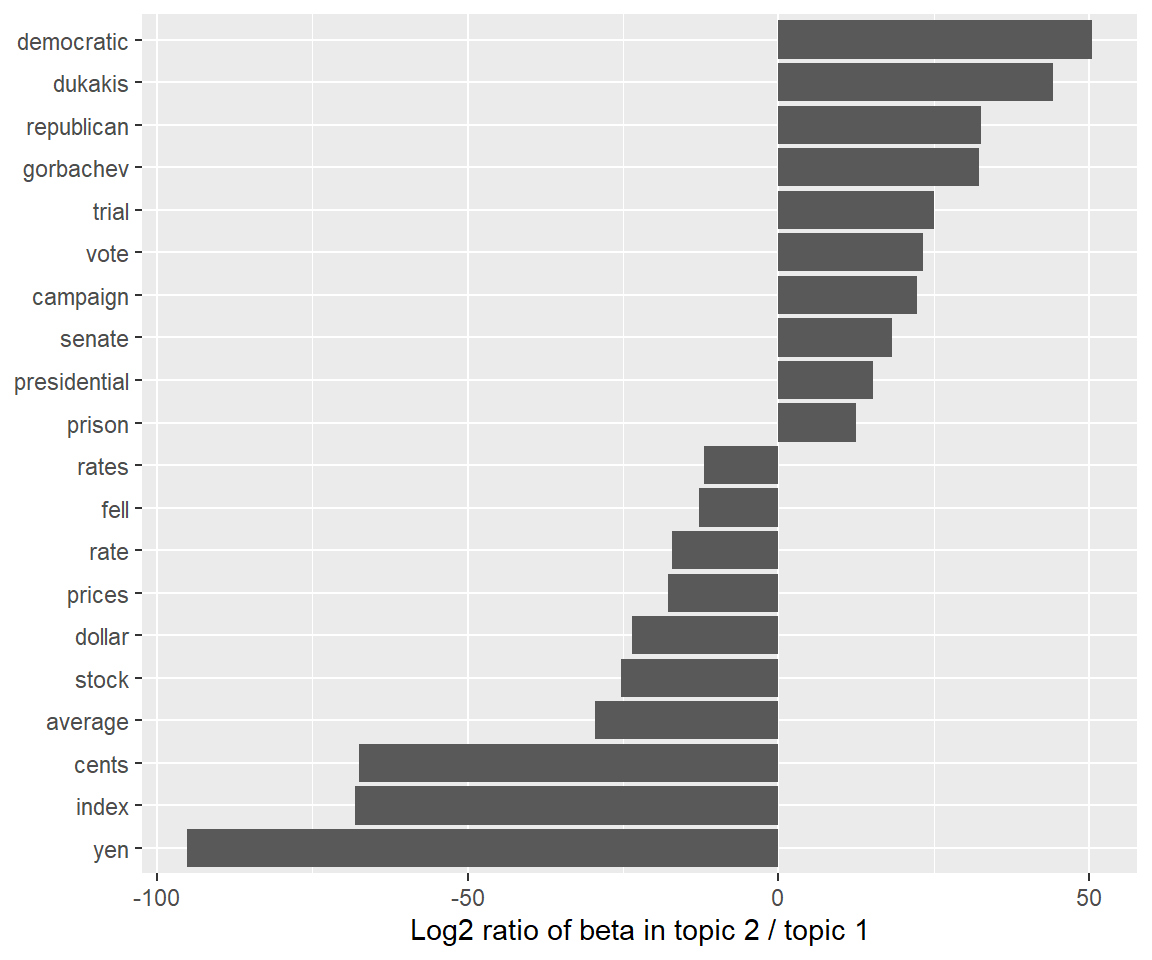
aid is in topic 2 than topic 1american comes from topic 1 compared to topic 2 (notice we swap which one is more likely due to the sign of the ratio being negative)This is a comparative analysis to distinguish topics based on words. Not a reflection on how likely those words are to occur.
dukakis and democrat are pretty much only in topic 2, yen and index in topic 1
beta_wide |>
ggplot(aes(topic1, topic2)) +
geom_abline(slope = 1, intercept = 0, linetype = "dashed", color = "grey50") +
geom_point(alpha = 0.4) +
ggrepel::geom_text_repel(
data = slice_max(beta_wide, pmax(topic1, topic2), n = 20),
aes(label = term), size = 3) +
coord_equal() +
labs(x = expression(beta ~ "in topic 1"), y = expression(beta ~ "in topic 2"))
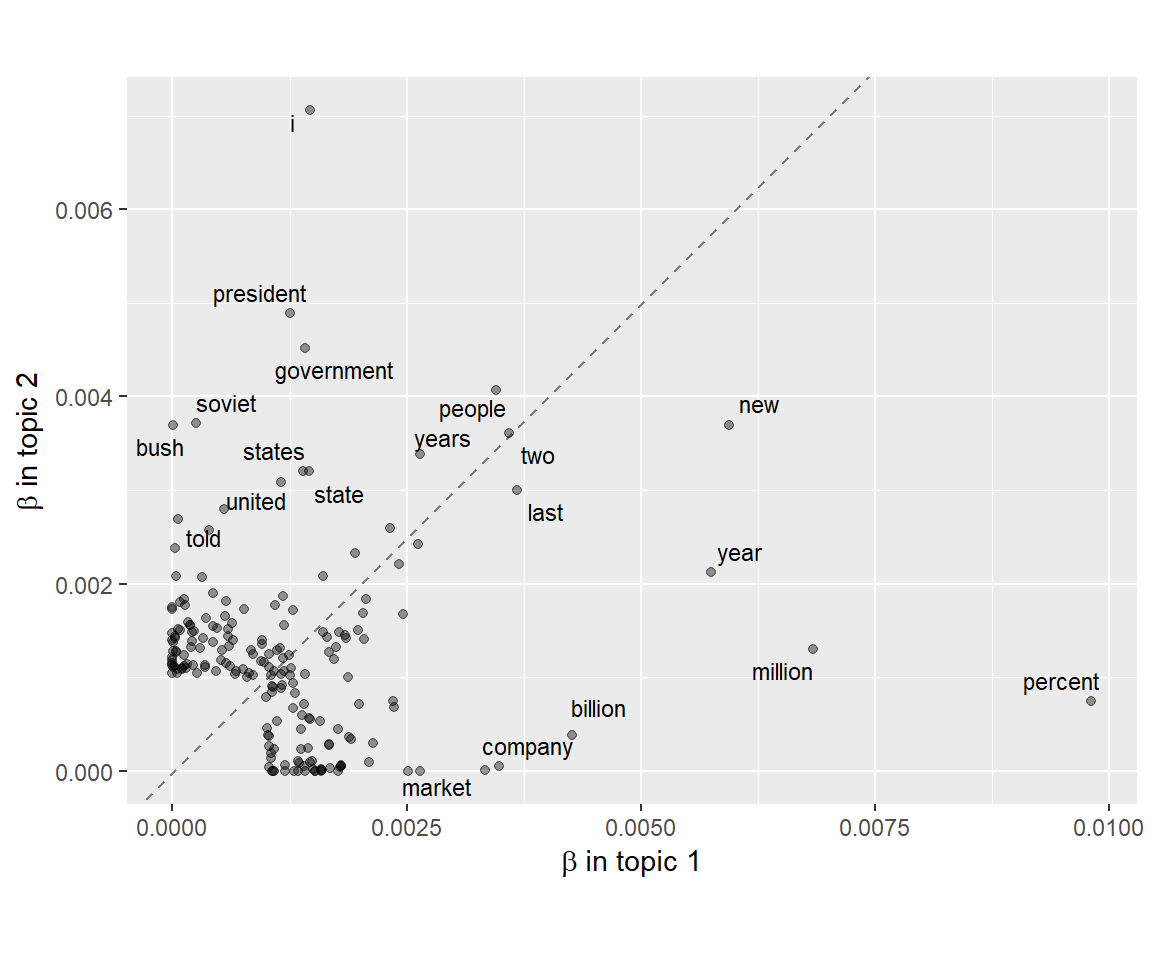
This picture only works for 2 topics. With k > 2 you need one axis per topic, so you’d have to compare topics two at a time.
# A tibble: 6 × 3
document topic gamma
<int> <int> <dbl>
1 1 1 0.248
2 2 1 0.362
3 3 1 0.527
4 4 1 0.357
5 5 1 0.181
6 6 1 0.000588
We can use pivot_wider() to create one row per article, one column per topic.
# A tibble: 10 × 3
document topic1 topic2
<int> <dbl> <dbl>
1 1 0.248 0.752
2 2 0.362 0.638
3 3 0.527 0.473
4 4 0.357 0.643
5 5 0.181 0.819
6 6 0.000588 0.999
7 7 0.773 0.227
8 8 0.00445 0.996
9 9 0.967 0.0330
10 10 0.147 0.853
# name each topic by its top 3 words
topic_labels <- ap_top_terms |>
group_by(topic) |>
slice_max(beta, n = 3) |>
summarize(label = paste(term, collapse = ", ")) |>
mutate(label = paste0("Topic ", topic, ": ", label))
ap_documents |>
filter(document <= 10) |>
left_join(topic_labels, by = "topic") |>
ggplot(aes(gamma, factor(document), fill = label)) +
geom_col() +
scale_y_discrete(limits = rev) +
scale_x_continuous(labels = scales::percent) +
guides(fill = guide_legend(nrow = 2)) +
labs(x = "share of the article", y = "article", fill = NULL) +
theme_minimal(base_size = 14) +
theme(legend.position = "bottom", panel.grid = element_blank())
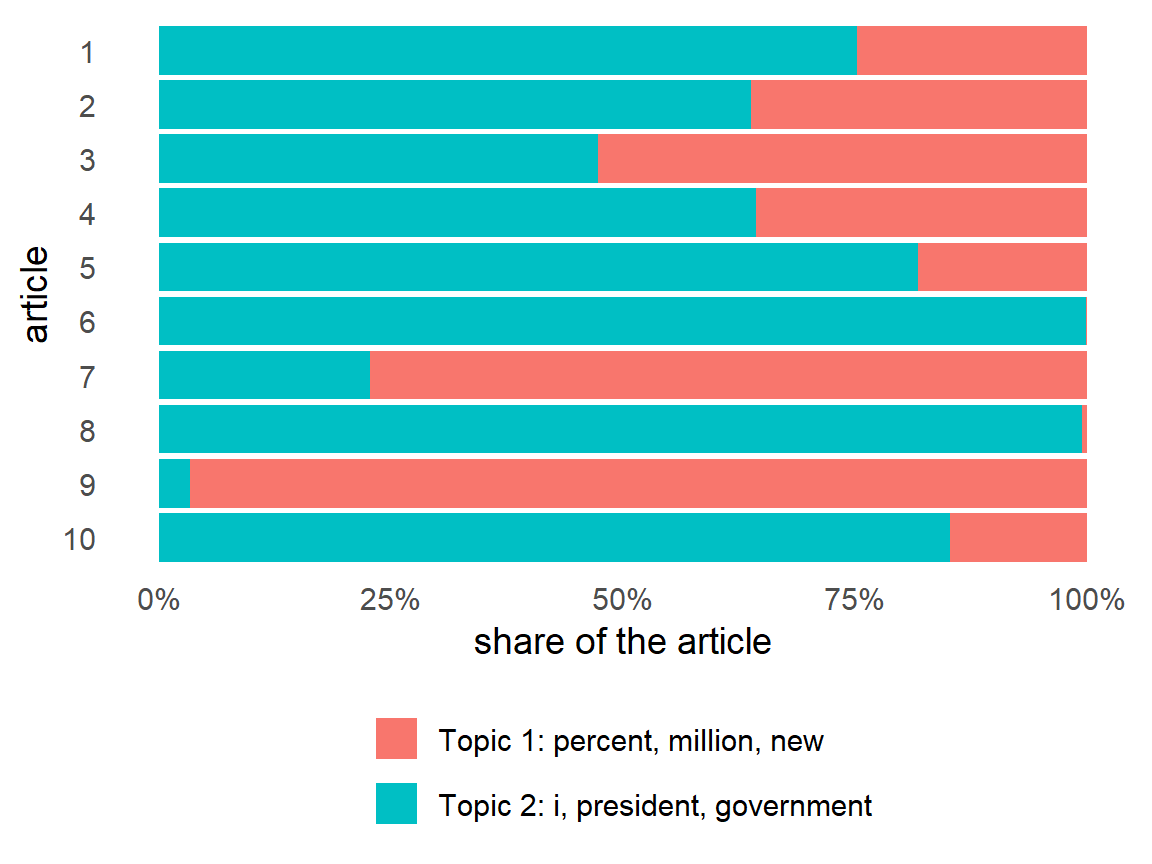
Noriega, Panama, Jackson, Powell: These are all associated with the US invasion of Panama in ’89. Topic 2 may have something to do with invasions?
Same habit: check the words, not just the score.
To help with classification, we can align a document with one specific topic. We can use slice_max(gamma) within each article (document) to keep only the row with the biggest \(\gamma\).
1 2
932 1314
1 2
0.4149599 0.5850401
58.5% (n=1314) of all news articles are in Topic 2
Caveat: A label throws away the blend: an article that is 53% topic 1 gets the same label as one that is 97% topic 1.
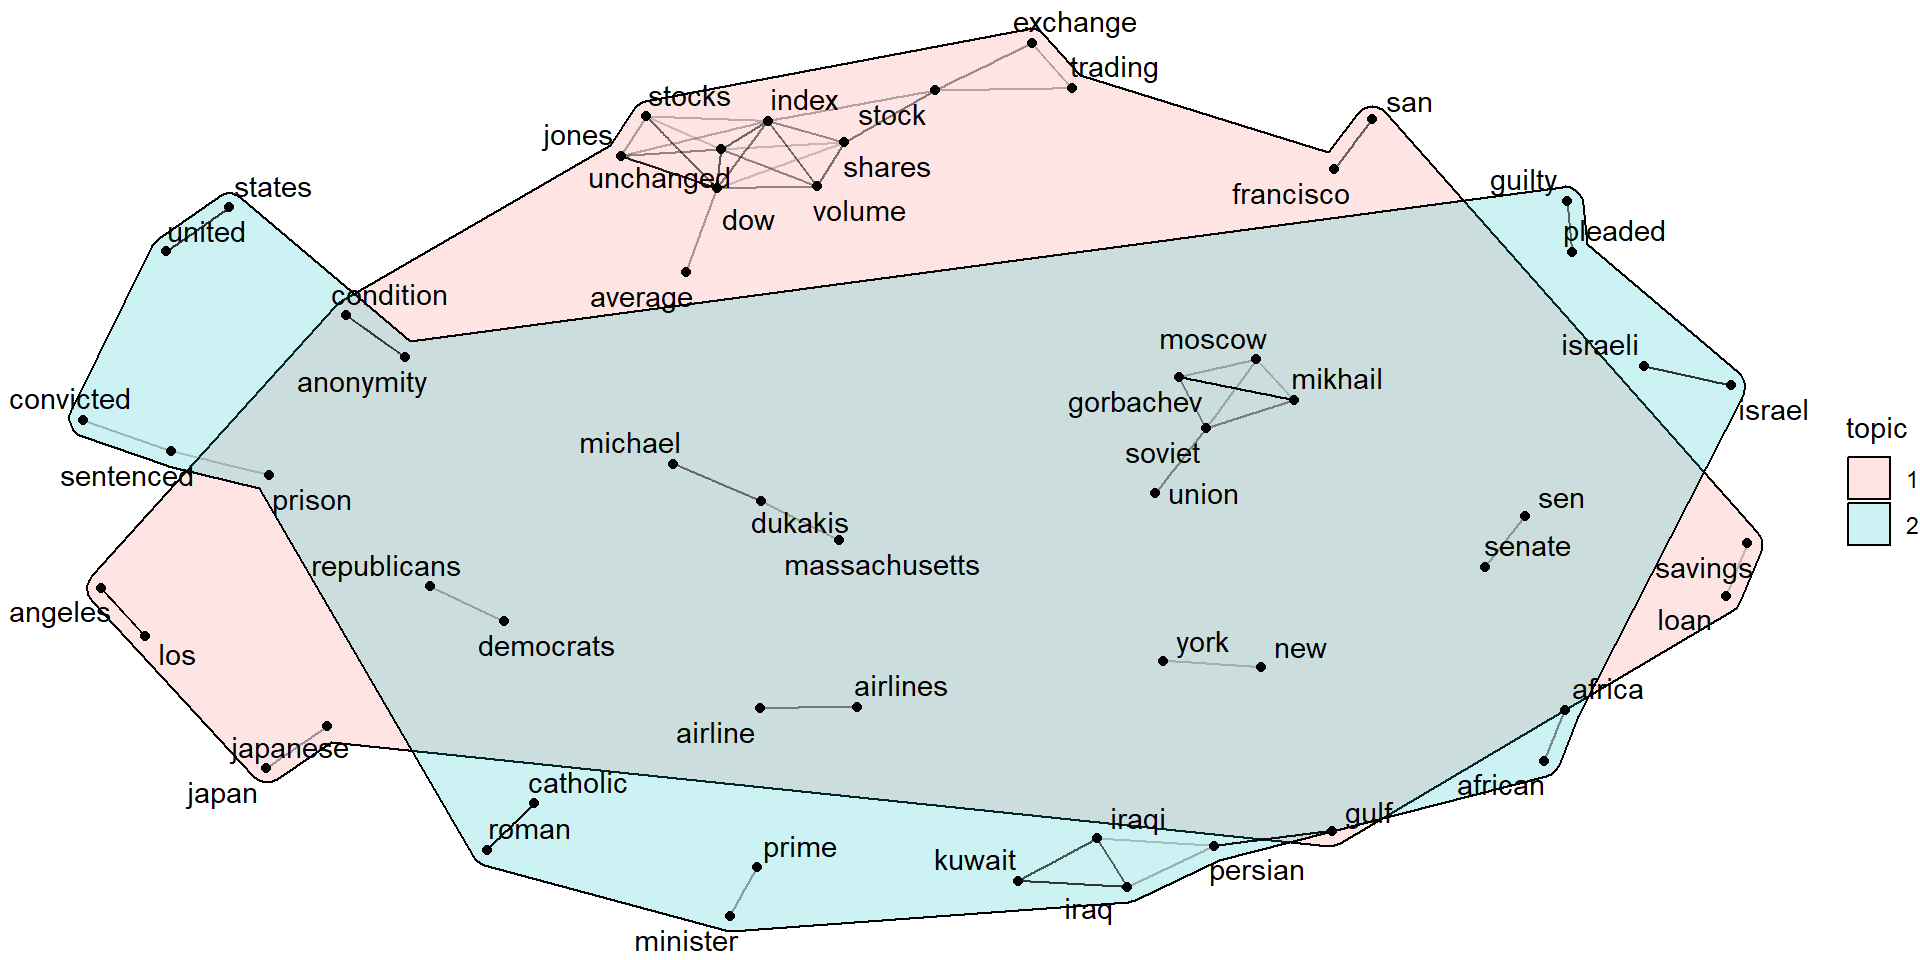
Combining the word correlation network graph, with the topic distribution can shed light on how well our LDA-identified topics cover the topics we can identify from the network graph
library(widyr) # pairwise_cor(), from lesson 05
library(igraph) # graph_from_data_frame()
library(ggraph) # network plot; installs ggforce for the hulls
# topics associated with words
word_topic <- ap_topics |>
group_by(term) |>
slice_max(beta, n = 1) |> # each word's best topic
ungroup() |>
transmute(name = term, topic = factor(topic))
# convert AP dtm to token form
ap_counts <- tidy(AssociatedPress) |>
count(document, term)
# convert word counts into correlations
cors <- ap_counts |>
group_by(term) |> filter(sum(n) >= 50) |> ungroup() |>
pairwise_cor(term, document, sort = TRUE) |> # same as 05
filter(correlation > .5)
# create the network graph
g <- graph_from_data_frame(cors, vertices = filter(word_topic, name %in% c(cors$item1, cors$item2)))
# set a seed and add "hulls"
set.seed(698)
ggraph(g, layout = "fr") +
ggforce::geom_mark_hull(aes(x, y, group = topic, fill = topic),
alpha = .2, concavity = 4, expand = unit(2, "mm")) +
geom_edge_link(aes(edge_alpha = correlation), show.legend = FALSE) +
geom_node_point() +
geom_node_text(aes(label = name), repel = TRUE) +
theme_void()What do you notice?
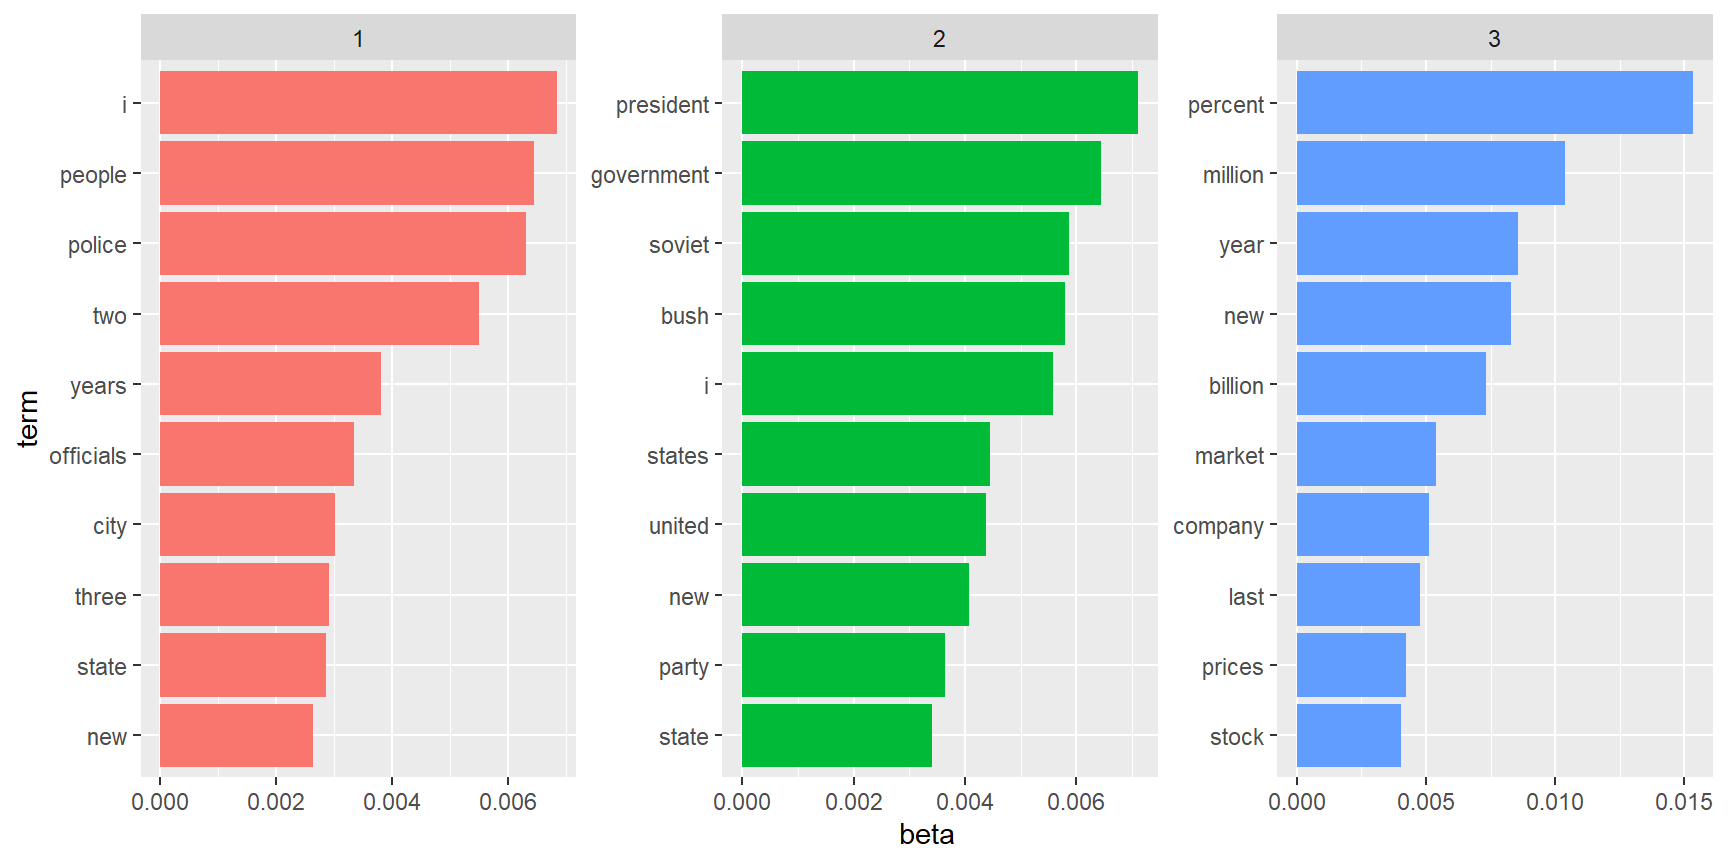
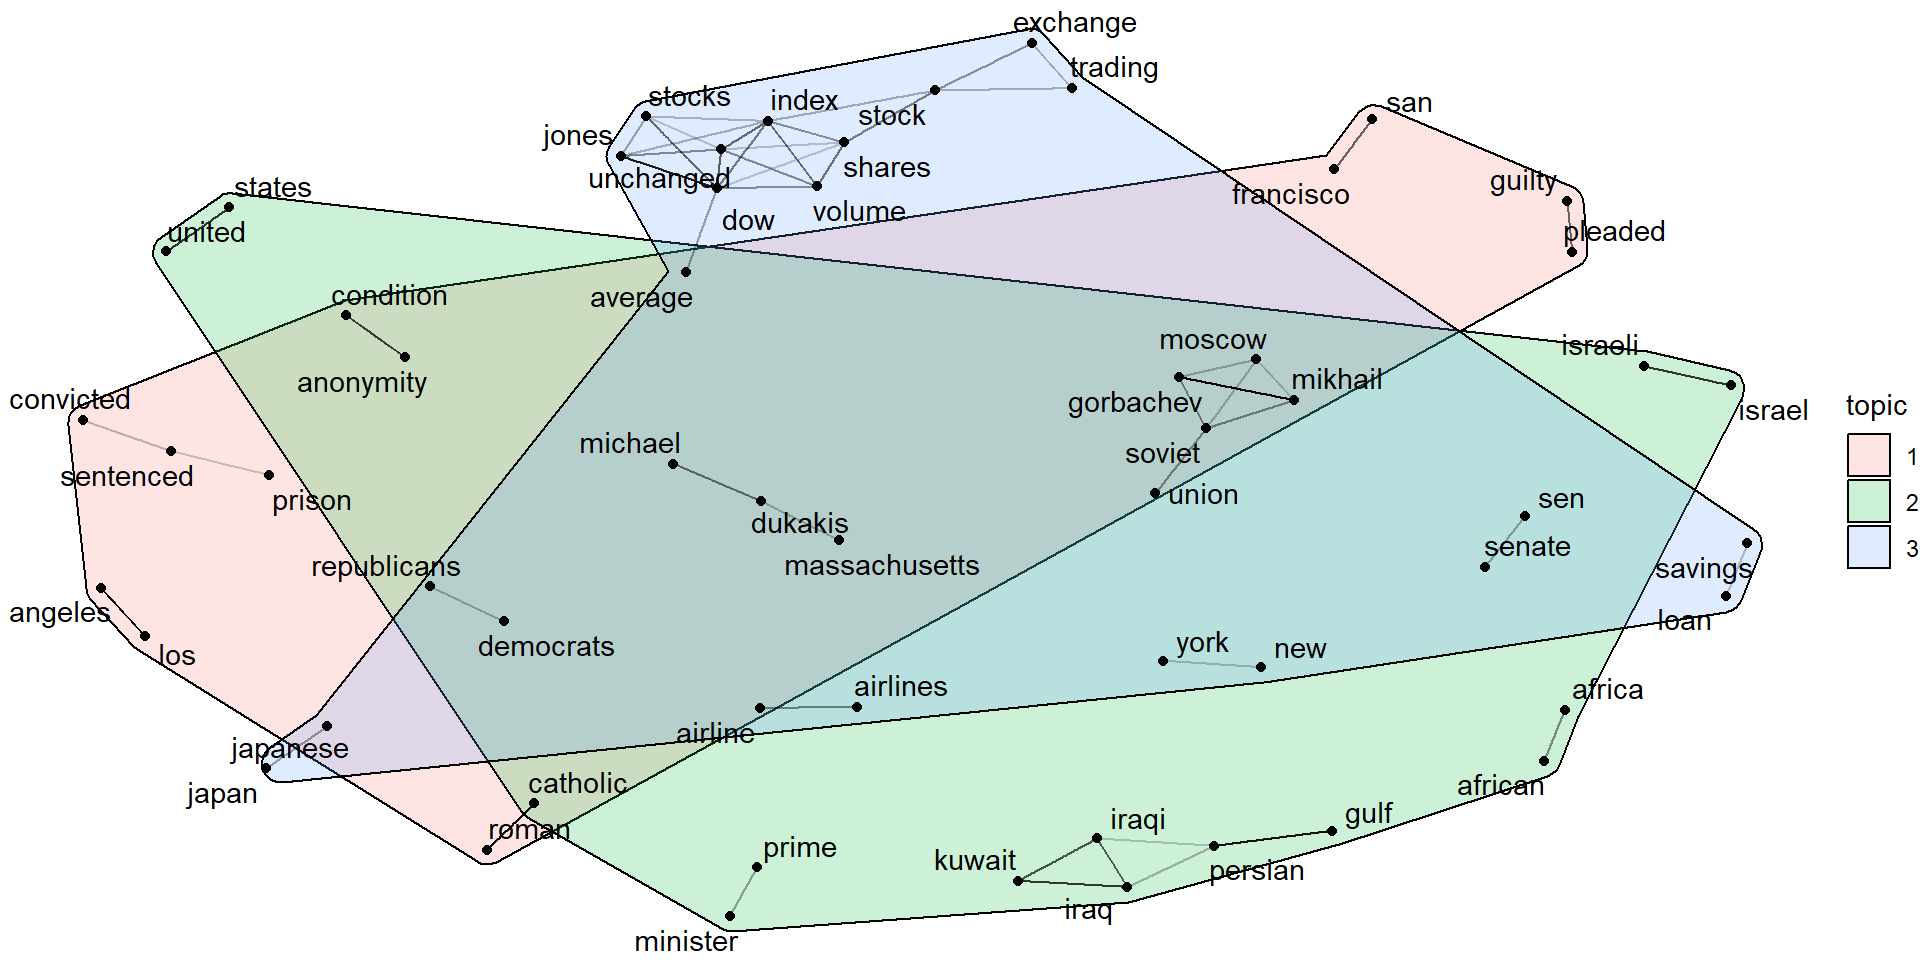
A LDA_VEM topic model with 3 topics.
Same data, same seed, one more topic. The topic number labels (1, 2, 3) are not guaranteed to mean the same thing as before.
Topic 3 is more clearly economic, but Topic 1 and 2 have some overlap.
ap_topics3 <- tidy(ap_lda3, matrix = "beta")
ap_top_terms3 <- ap_topics3 |>
group_by(topic) |>
slice_max(beta, n = 10) |>
ungroup() |>
arrange(topic, -beta)
ap_top_terms3 |>
mutate(term = reorder_within(term, beta, topic)) |>
ggplot(aes(beta, term, fill = factor(topic))) +
geom_col(show.legend = FALSE) +
facet_wrap(~ topic, scales = "free") +
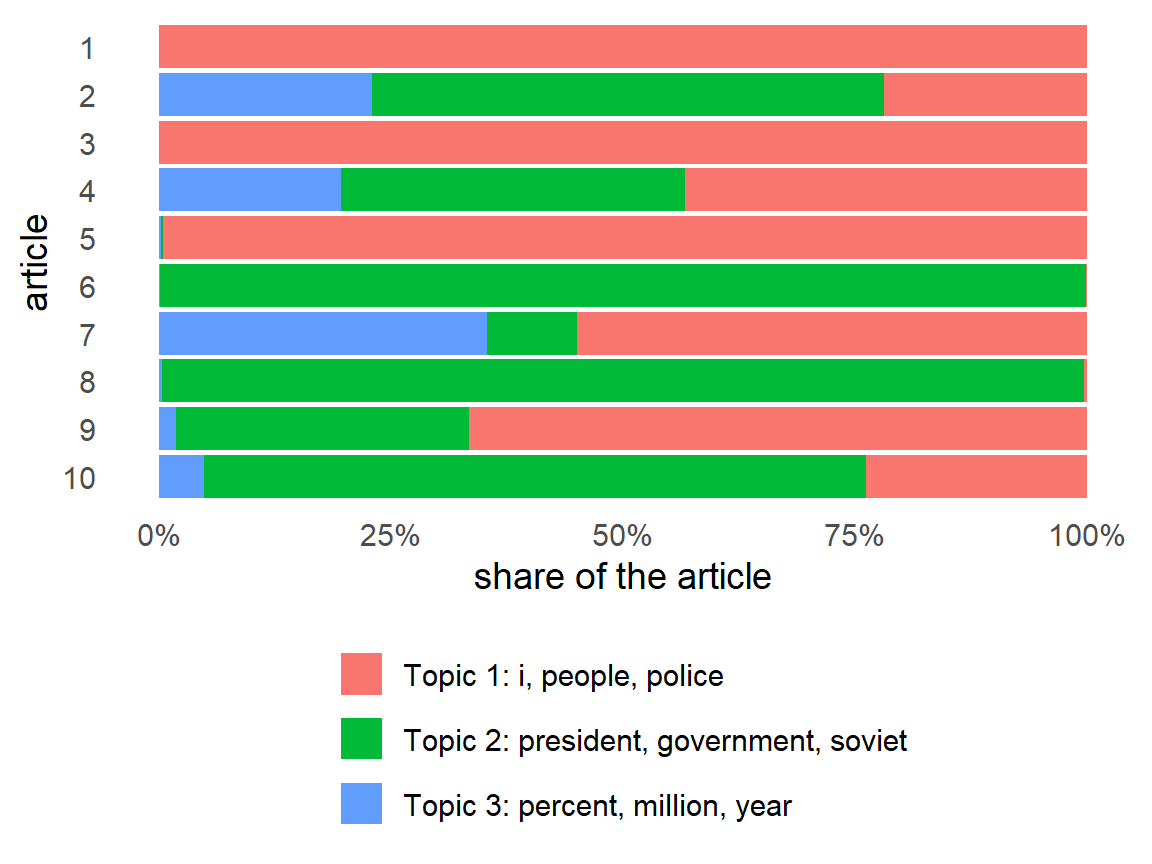
scale_y_reordered()Some articles became more clearly a single topic (e.g. 1, 3, 5, 6, 8)
# name each topic by its top 3 words
topic_labels3 <- ap_top_terms3 |>
group_by(topic) |>
slice_max(beta, n = 3) |>
summarize(label = paste(term, collapse = ", ")) |>
mutate(label = paste0("Topic ", topic, ": ", label))
tidy(ap_lda3, matrix = "gamma") |>
filter(document <= 10) |>
left_join(topic_labels3, by = "topic") |>
ggplot(aes(gamma, factor(document), fill = label)) +
geom_col() +
scale_y_discrete(limits = rev) +
scale_x_continuous(labels = scales::percent) +
guides(fill = guide_legend(nrow = 3)) +
labs(x = "share of the article", y = "article", fill = NULL) +
theme_minimal(base_size = 14) +
theme(legend.position = "bottom", panel.grid = element_blank())
Same word network and seed as the k = 2 map, so the words should sit in the same places. Only the topic hulls change.
# each word's best topic, now from the k = 3 model
word_topic3 <- ap_topics3 |>
group_by(term) |>
slice_max(beta, n = 1) |>
ungroup() |>
transmute(name = term, topic = factor(topic))
# same word correlations (cors) as the k = 2 map
g3 <- graph_from_data_frame(cors, vertices = filter(word_topic3, name %in% c(cors$item1, cors$item2)))
set.seed(321)
ggraph(g3, layout = "fr") +
ggforce::geom_mark_hull(aes(x, y, group = topic, fill = topic),
alpha = .2, concavity = 4, expand = unit(2, "mm")) +
geom_edge_link(aes(edge_alpha = correlation), show.legend = FALSE) +
geom_node_point() +
geom_node_text(aes(label = name), repel = TRUE) +
theme_void()Roberts, Stewart & Tingley (2016). “Navigating the Local Modes of Big Data: The Case of Topic Models.” In Computational Social Science: Discovery and Prediction. Cambridge University Press.
Fit the same model with a different seed, then put the top 5 terms side by side.
ap_lda_698 <- LDA(AssociatedPress, k = 2, control = list(seed = 698))
bind_rows(
tidy(ap_lda, matrix = "beta") |> mutate(seed = 1234),
tidy(ap_lda_698, matrix = "beta") |> mutate(seed = 698)) |>
group_by(seed, topic) |>
slice_max(beta, n = 5) |>
summarize(top_terms = paste(term, collapse = ", "), .groups = "drop")# A tibble: 4 × 3
seed topic top_terms
<dbl> <int> <chr>
1 698 1 percent, million, new, year, bush
2 698 2 i, people, two, police, government
3 1234 1 percent, million, new, year, billion
4 1234 2 i, president, government, people, soviet
Do the topics match? The same two topics with the numbers swapped? Or a different split?
-2*logLik() is a common measure of model fit. The larger the betterlogLik(), or let nstart + best = TRUE do ittidy() turns a DTM into tidy rows; cast_dtm() turns tidy counts into a DTMQualitative Methods (MATH 689/POLS 671 Fall 26) - https://wickedproblems.netlify.app