Homework 1: Sample Characteristics
Introduction
In this assignment you will start to work with Amy’s research data: Criminal Justice Personal Connections Survey“. As part of this week’s assignment you will be familiarizing yourself with the survey tool and questions that were asked. The survey tool can be found in the Week 3 Google drive folder.
Your goal in this assignment is to describe the sample. How many people were surveyed? From what age ranges, nationalities and majors?
Most questions in this assignment require you to write code to answer a question, but don’t forget to write the answer in an English sentence also! Typically code is not an answer by itself.
When answering a question with data, your answer should consist of full English sentences with supporting numbers. A great example is the Frequency tables description in the 02-wwd code along.
Get the data
The data set is called demog.csv and available in our Jupyterhub Wicked/data folder. Copy this file to your own home directory.
The first code chunk to load the necessary packages and data has been set up for you.
What variables do we have?
- Use
glimpse()to inspect the variables in thedemogdata set. Match these variable names to the codebook, and write 1-2 “human readable” words that describe what this variable is about. The first three have been started for you
glimpse(demog)Rows: 248
Columns: 10
$ consent <chr> "Yes (clicking 'yes' confirms that you are 18+ years of age an…
$ Q1 <chr> "18-24", "25-30", "18-24", "18-24", "18-24", "25-30", "18-24",…
$ Q2 <chr> "White, non-Hispanic and non-Latinx", "White, non-Hispanic and…
$ Q3 <chr> "Woman", "Man", "Woman", "Woman", "Man", "Man", "Woman", "Woma…
$ Q4 <chr> "No", "Yes", "Yes", "Yes", "No", "No", "No", "No", "Yes", "Yes…
$ Q5_1 <chr> "Financially SECURE", "Somewhat financially SECURE, with perio…
$ Q6 <chr> "Straight", "Straight", "Bisexual", "Straight", "Straight", "S…
$ Q7 <chr> "Criminal Justice major", "Criminal Justice major", "Criminal …
$ Q8 <chr> "No", "No", "No", "Yes", "Yes", "Yes", "Yes", "No", "Yes", "No…
$ Q12 <chr> "3.5-4.0", "3.5-4.0", "3.5-4.0", "3.0-3.49", "3.0-3.49", "3.5-…- consent: Consent
- Q1: Age
- Q2: Race/Ethnicity
- Q3: Gender
- Q4: Rural
- Q5_1: Financial security
- Q6: Sexual Orientation
- Q7: Major
- Q8: First Gen
- Q12: Cumulative GPA
- Using the information from
glimpse, how many rows (observations, people) do we have, and how many columns (variables/characteristics)
There is 248 observations and 10 variables.
- Not everyone consented to participate in this research. Create a
table()of theconsentvariable and report how many said “No”.
table(demog$consent)
                                                                                                                 No
                                                                                                                  6
Yes (clicking 'yes' confirms that you are 18+ years of age and that you are voluntarily participating in the study)
                                                                                                                236
6 individuals did not consent.
- Even if there is data on the individuals that said “no” they did not consent, it is not ethical to use those data rows. Use the tactics shown in
02-wwdunderConditional subsettingto make a new data frame calleddemog_analysisthat filters thedemogdata set to only keeps rows whereconsent != "No"
demog_analysis <- filter(demog, consent != "No")Sample Characteristics
Answer the following questions on the analysis data set (demog_analysis)
- How old are students in the analysis data set? Your answer should include both numbers and percents.
table(demog_analysis$Q1)
18-24 25-30 31-35 36-40 41-45 61-65
190 23 4 3 2 2 table(demog_analysis$Q1) |> prop.table()
      18-24       25-30       31-35       36-40       41-45       61-65
0.848214286 0.102678571 0.017857143 0.013392857 0.008928571 0.008928571
The vast majority of students are 18-24 years old, (n=190, 84.8%), another 10% (n=23 ) are between 25-30 with 11 students 31 years or older.
- What genders are represented? Create a plot then answer this question.
plot_frq(demog_analysis$Q3)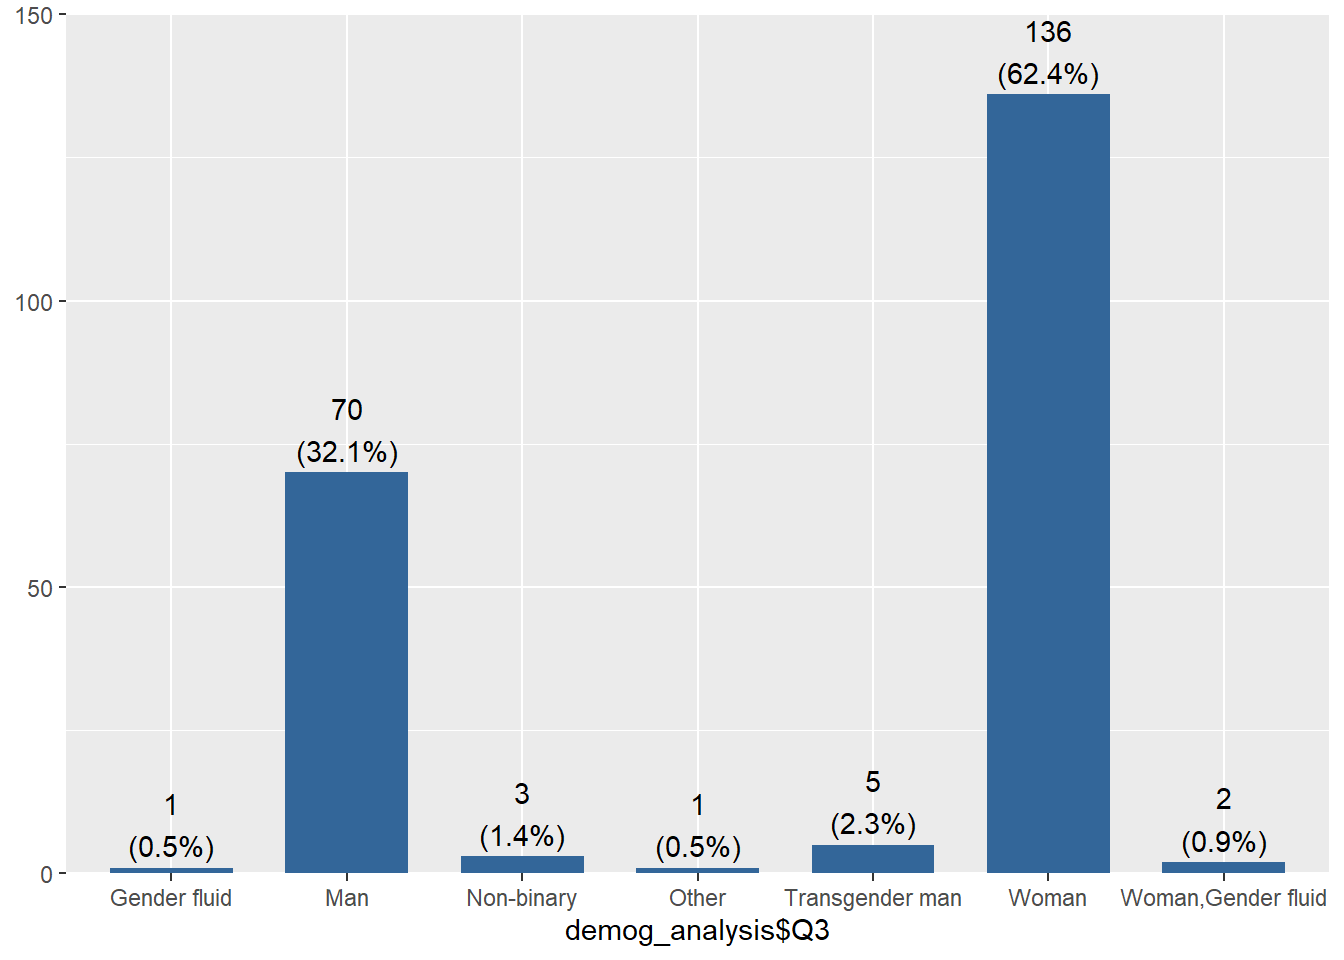
Two thirds of survey participants identify as a woman 62.4% (n=136), another third identify as a Man (n=70, 32.1%). Other responses include transgender man, non-binary and gender fluid.
- Describing the racial/ethnic makeup of participants is challenging with the data as collected. Identify and describe why this is the case. Run at least one R command to demonstrate the difficulty. Hint: You will have to read the codebook carefully and think back to examples we saw in class on day 1.
demog_analysis$Q7[1:10] [1] "Criminal Justice major"
[2] "Criminal Justice major"
[3] "Criminal Justice major ,Paralegal Certificate Program participant"
[4] "Criminal Justice major"
[5] "Criminal Justice major"
[6] "Criminal Justice major"
[7] "Political Science major with a Legal Studies Option,Paralegal Certificate Program participant"
[8] "Political Science major with a Legal Studies Option"
[9] "Criminal Justice major"
[10] "Criminal Justice major" This is a “mark all that apply” variable. It would have to be tidied up to show one major per person, or perhaps make a new category that identifies double/multiple majors.
- Pick one other variable to describe. Create a table, a proportion table, and a barplot of this variable. Describe some patterns you see using both N’s and %’s in your answer.
table(demog_analysis$Q5_1)
                                         Financially INSECURE
                                                           17
                                           Financially SECURE
                                                           69
Somewhat financially INSECURE, with periods of feeling SECURE
                                                           60
Somewhat financially SECURE, with periods of feeling INSECURE
63 table(demog_analysis$Q5_1) |> prop.table()
                                         Financially INSECURE
                                                   0.08133971
                                           Financially SECURE
                                                   0.33014354
Somewhat financially INSECURE, with periods of feeling SECURE
                                                   0.28708134
Somewhat financially SECURE, with periods of feeling INSECURE
0.30143541 plot_frq(demog_analysis$Q5_1)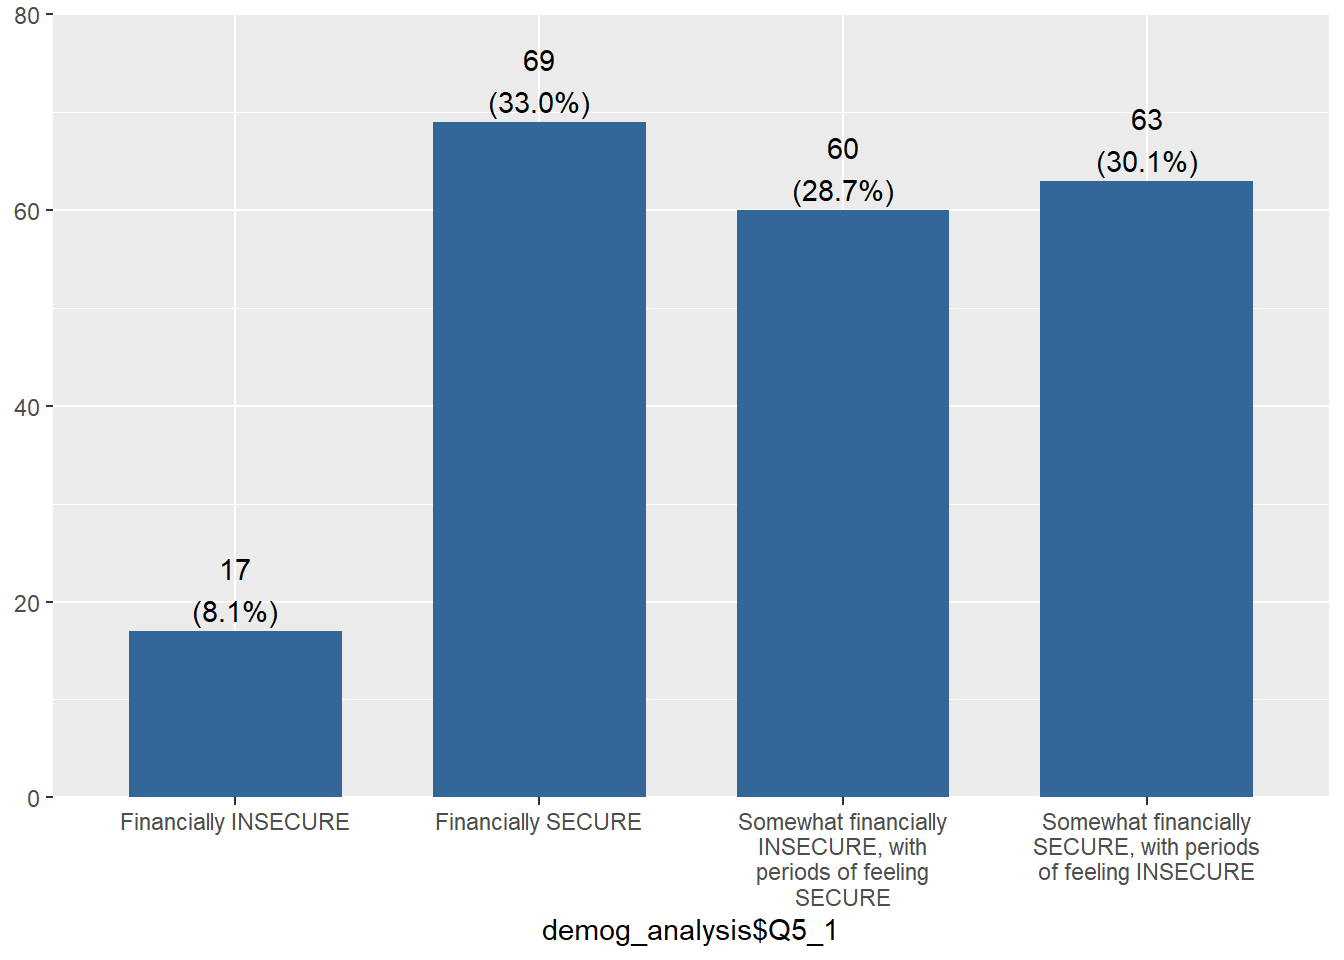
Less than 10% of respondents report being financially insecure (n=17). nearly equal thirds report the other three categories being financially secure, somewhat insecure with periods of security, and somewhat secure with periods of feeling insecure.
- Often we are interested in average gpa for groups of people. Is it possible to calculate the average GPA for students in this data set? Why or why not? You must justify your answer using the results from code or describe some feature about the data in your answer.
class(demog_analysis$Q12)[1] "character"table(demog_analysis$Q12)
     2.0-2.49      2.5-2.99      3.0-3.49       3.5-4.0 Less than 2.0
           11            33            63            53             6
We cannot calculate an average GPA using this data because the data is not numeric.
- Write one research question that we could try to answer with this data. Identify the specific variables that you would use.
Is being first generation (Q8) associated with GPA (Q12)?